What Every Parent Needs to Know About Linking Chores and Money
Few parenting topics start more kitchen-table arguments than "should we pay the kid for chores?" Half the internet says yes — it teaches earned income, work ethic, the basic shape of a paycheck. The other half says absolutely not — chores are part of being in a family, not a job, and paying for them turns out a child who treats unloading the dishwasher like a billable transaction. Both sides have a point. The actual answer, which almost no one writes about clearly, is that the right chore chart sits in the middle: some chores are family contributions you don't pay for, some chores are paid work that teaches real money lessons, and the line between them is drawn deliberately, not by accident.
Key things to know:
- A chore chart that teaches finance has two distinct lists — unpaid family contributions and paid "above and beyond" jobs. The split is the whole lesson.
- Pay-per-chore systems work better than flat allowance for kids ages 6–10. The cause-and-effect is what the brain needs to lock in the lesson.
- The chart itself must be physically visible somewhere the family passes daily. A chart in a drawer is dead by week two.
- By age 11, kids can handle a hybrid model — a small base allowance plus pay for bigger jobs. This mirrors the salary-plus-bonus shape they'll meet in adult life.
- Roughly 68% of US parents say they tie at least some money to chores, but only about 1 in 4 use a written chart that actually tracks payouts. The written chart is what separates teaching from improvising.
- The goal of paying for chores isn't the chores. It's connecting the words "earned," "saved," and "spent" to a real piece of physical work your kid did this week.
Core considerations before you start:
- Decide upfront which chores are "you live here, you do them" and which are paid. Write the lists separately on the same chart.
- Set a payday. Sunday after dinner is hard to beat. Random payouts kill the cause-and-effect lesson faster than skipped weeks ever do.
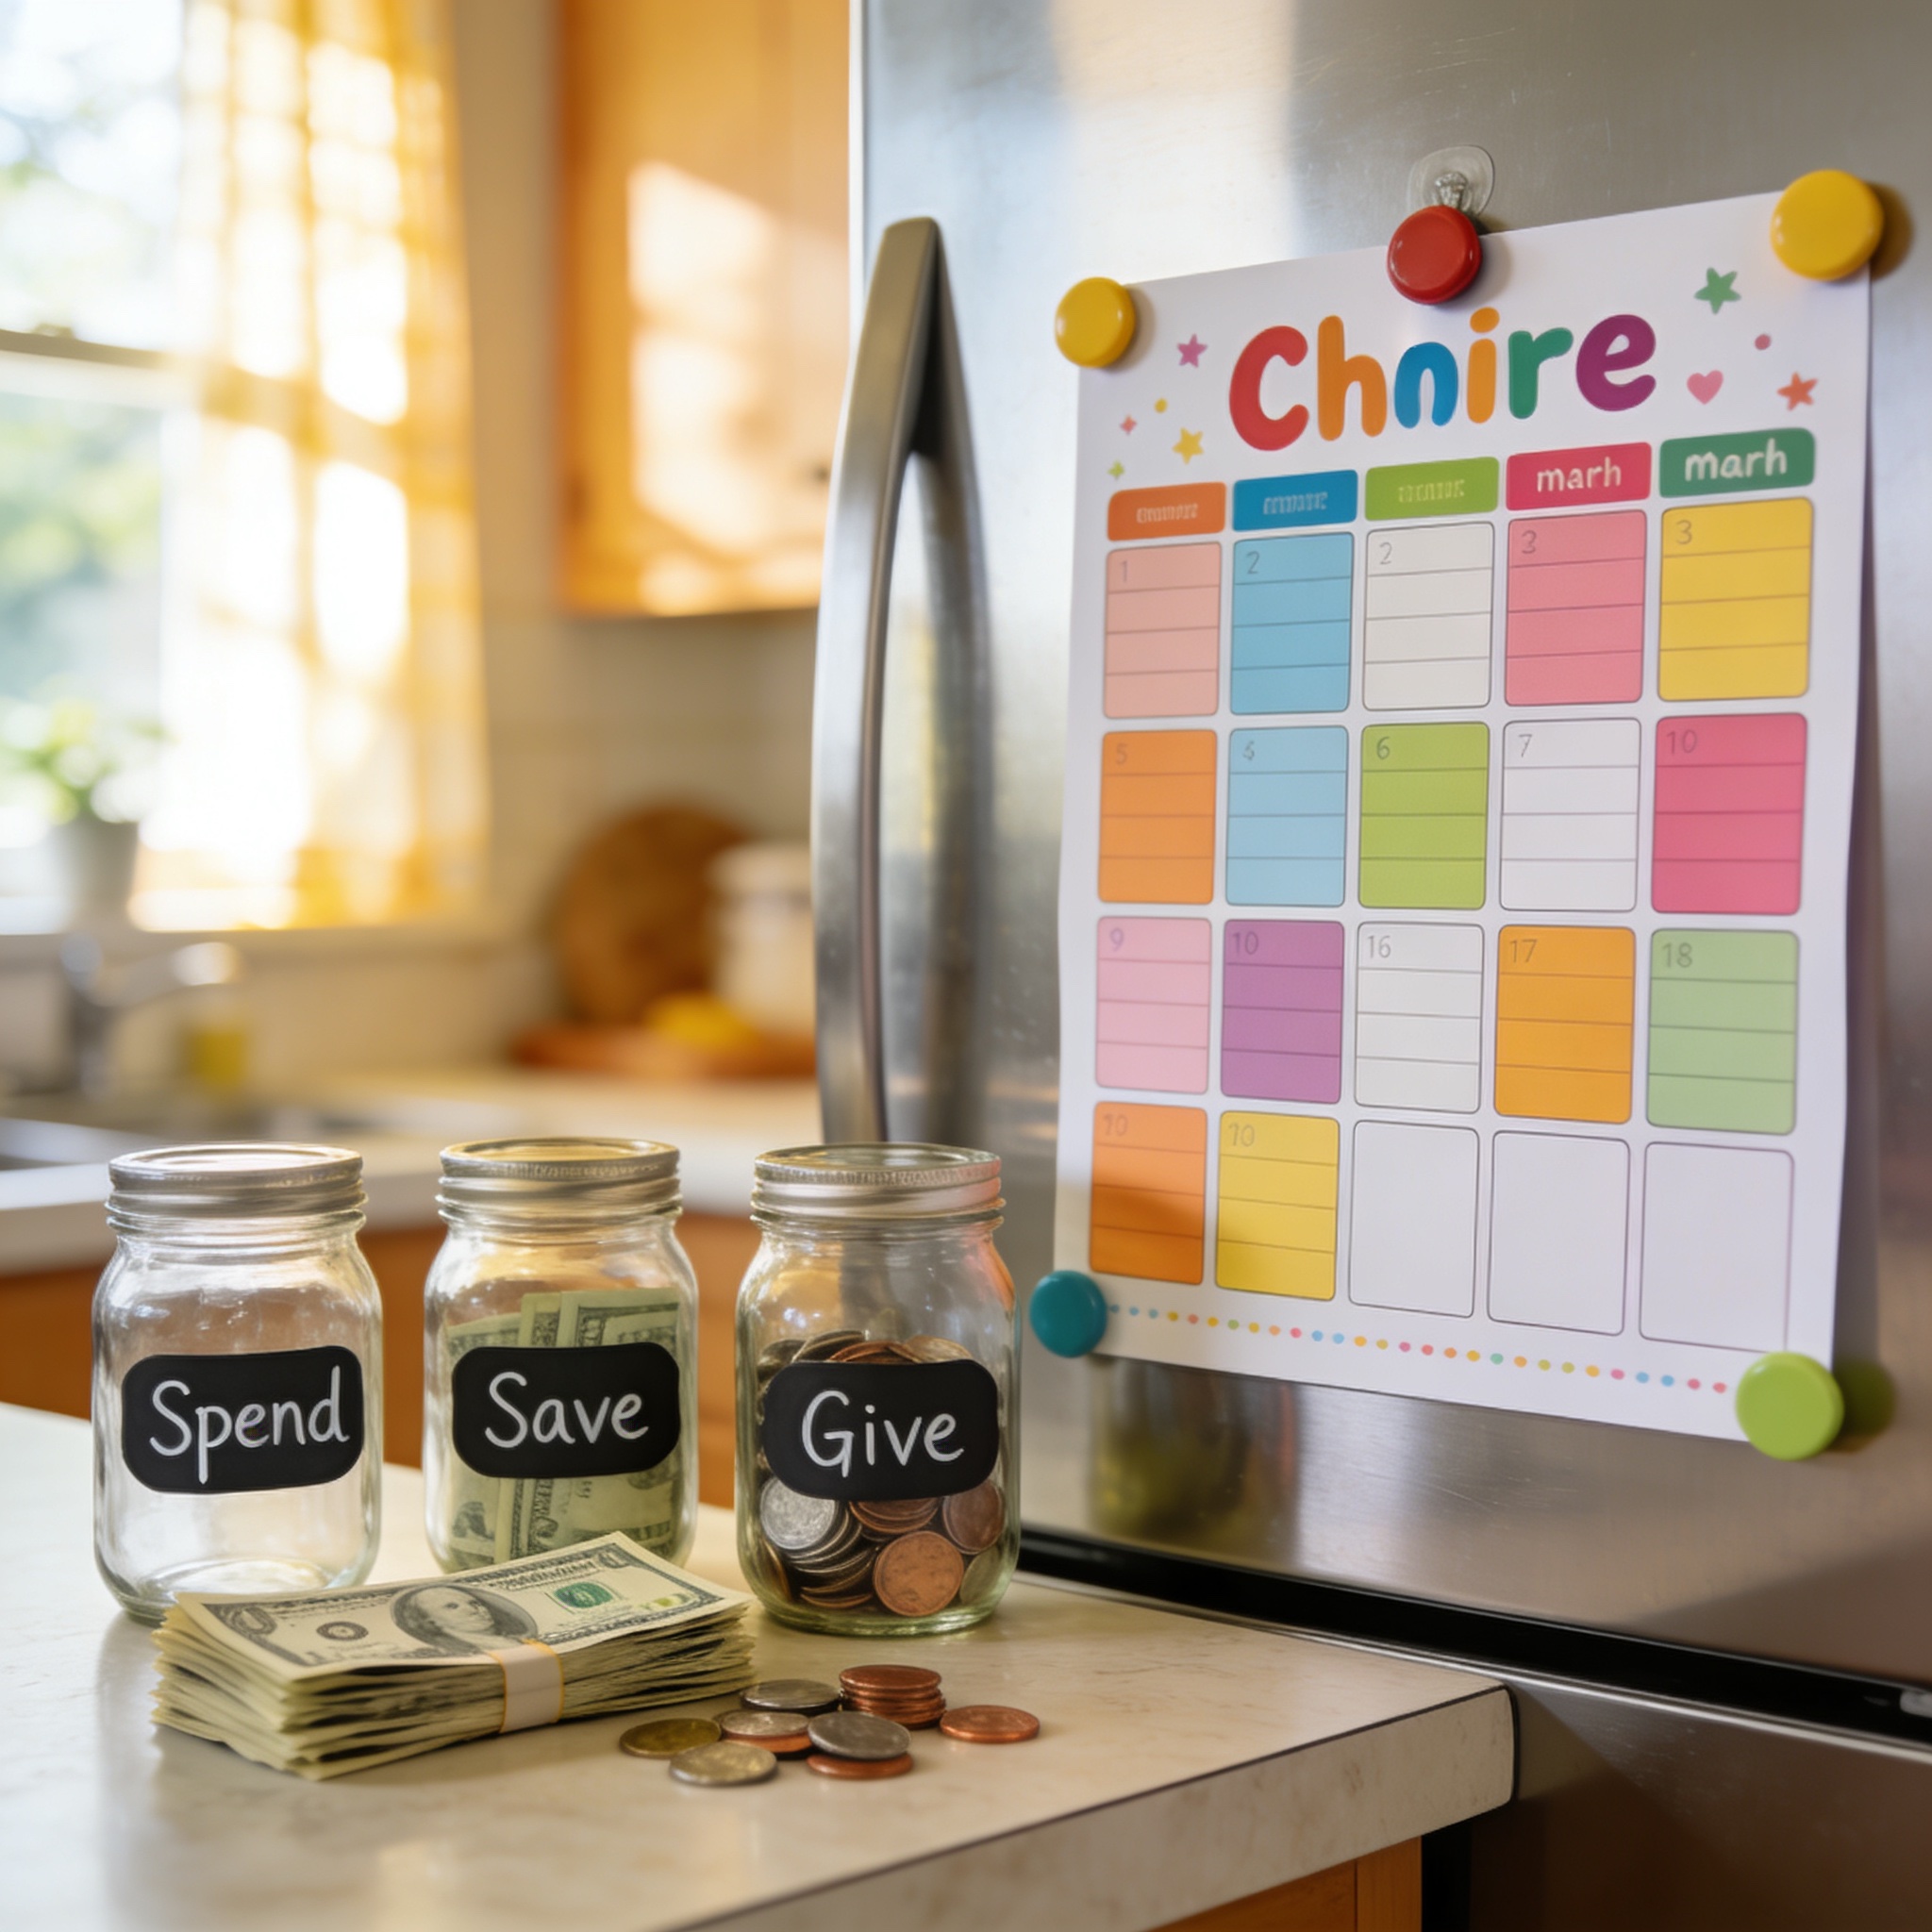
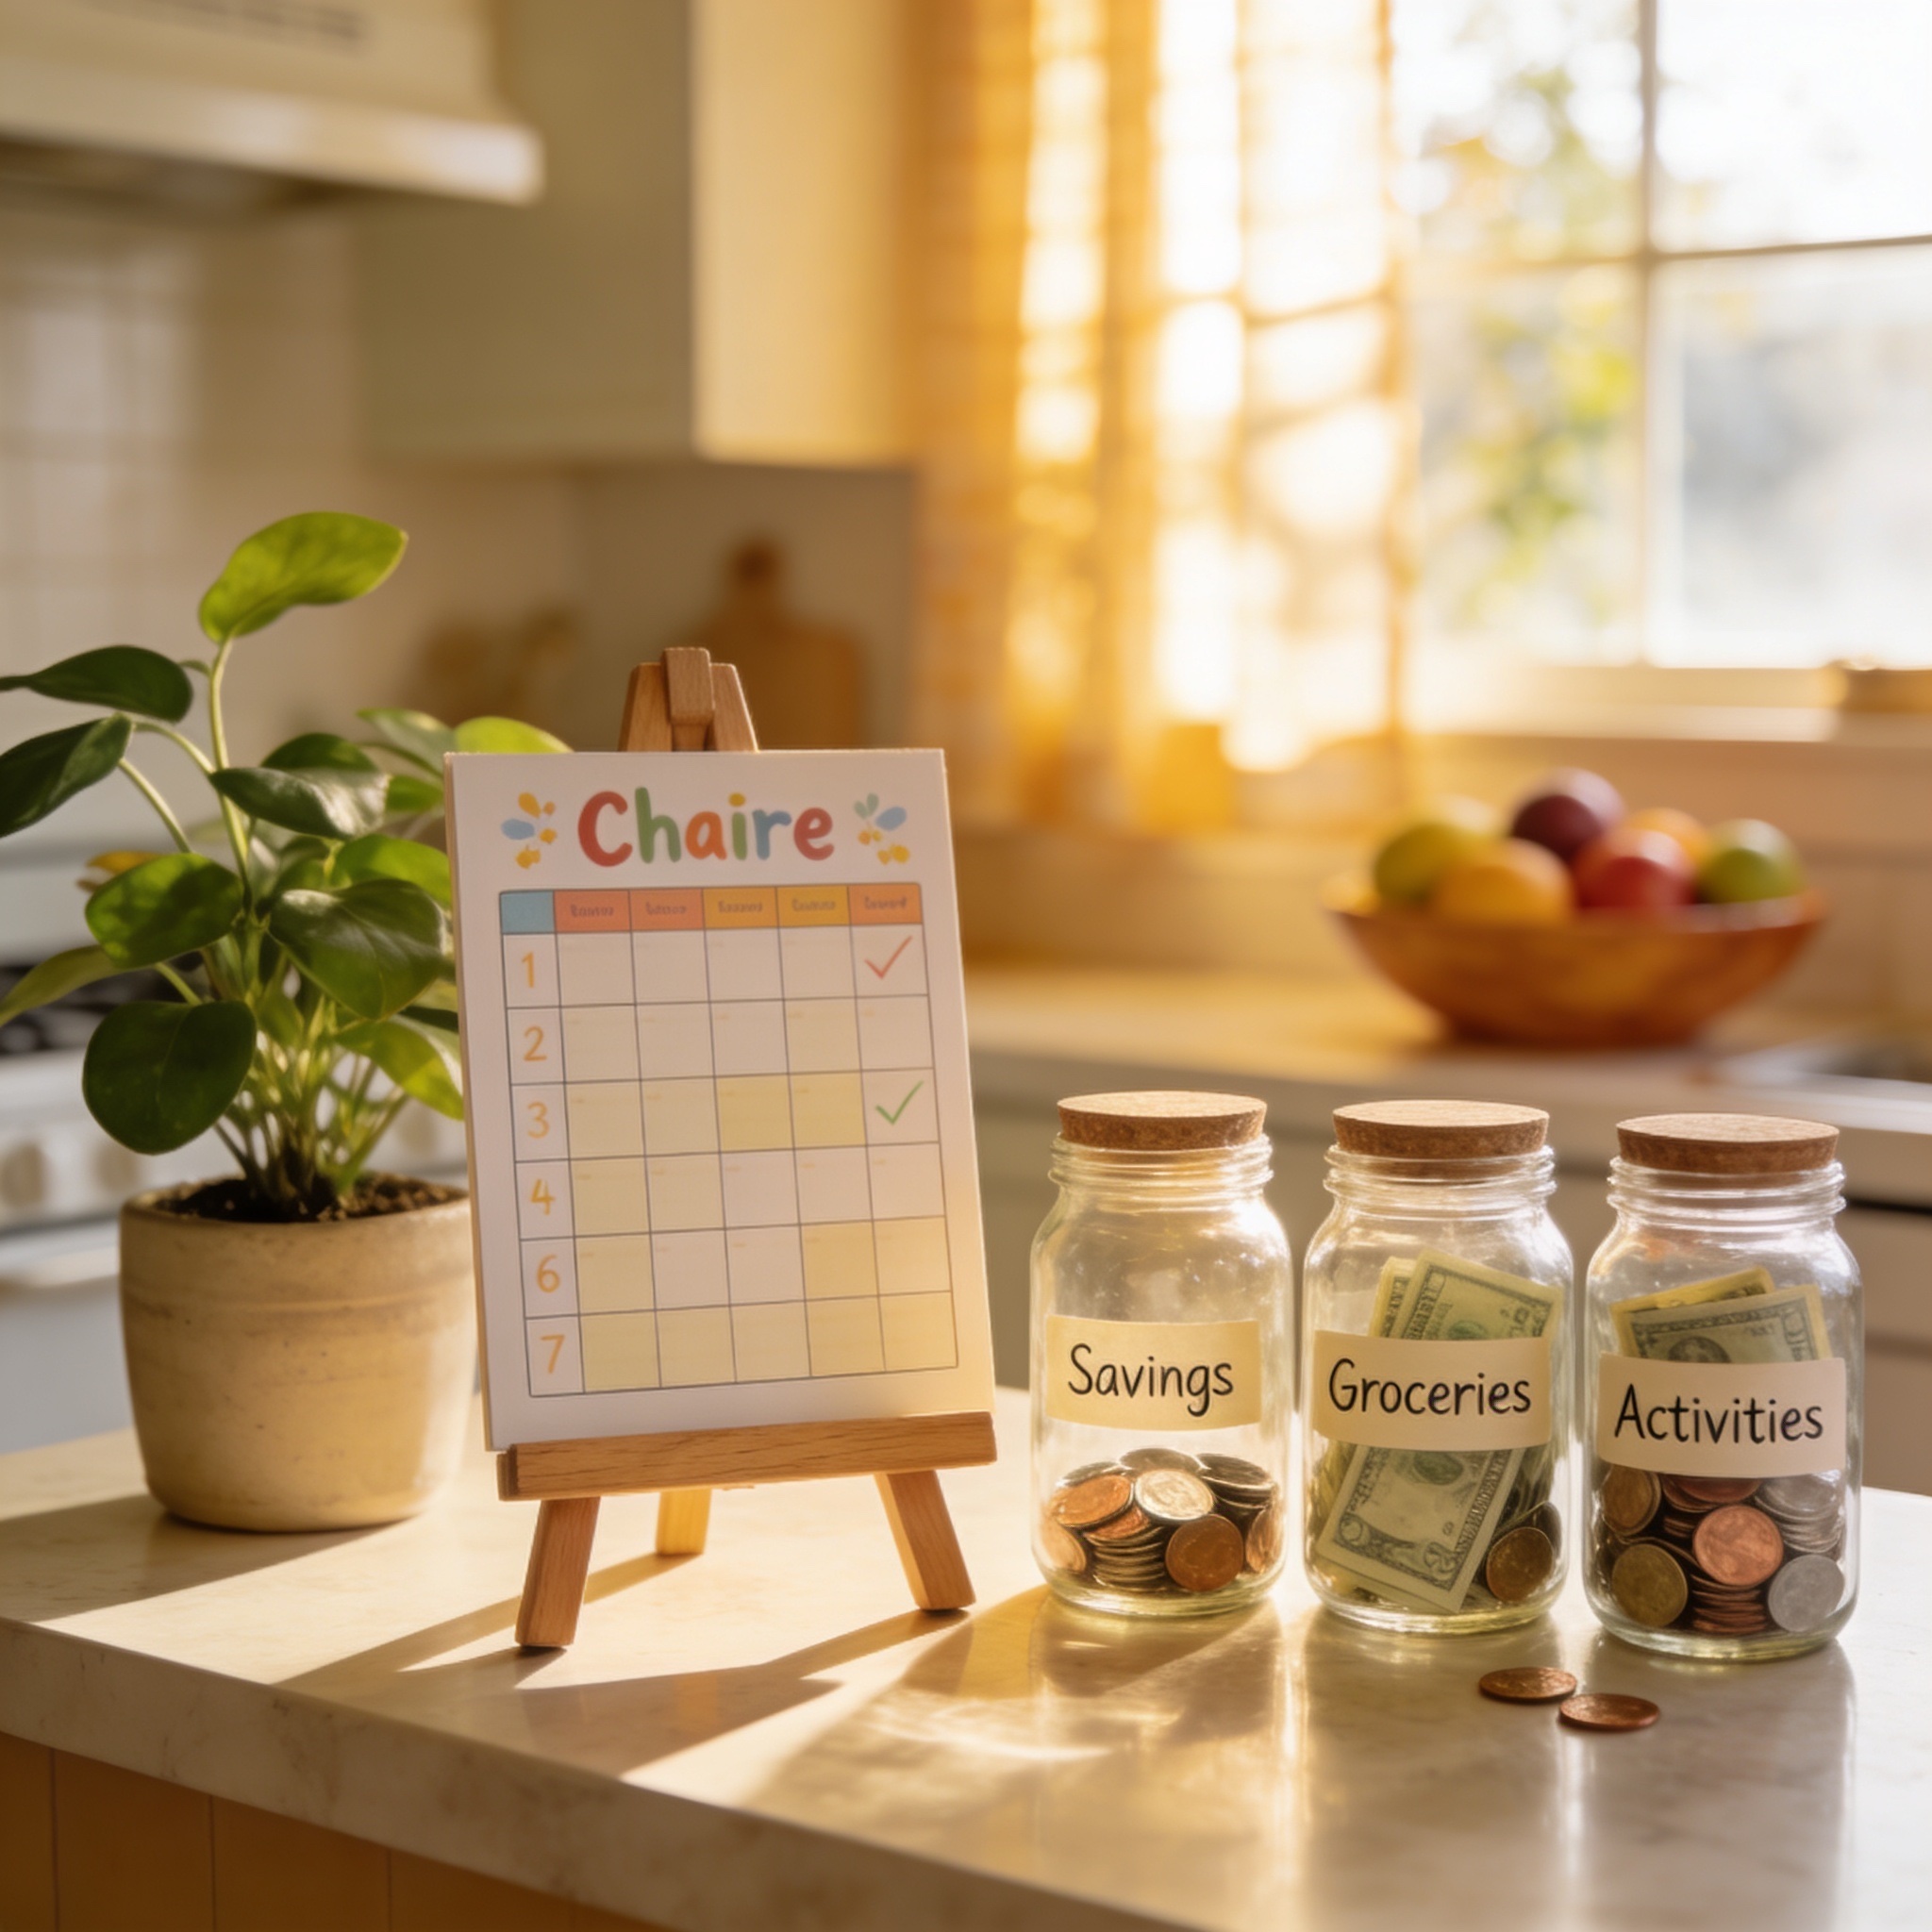
- Pair the chart with a place for the money to go — three labeled jars, a sealed envelope, or the BuckBook app — not a wad in a pocket.
- Match the pay scale to your kid's age and to your local market for the same chore. A $5 lawn-mow at age 12 reads differently from a $5 trash-out at age 7.
- Plan the conversation about what happens when chores aren't done. Lost pay? Reduced pay? Make-up jobs? Decide before week one — not in the middle of week three.
Done right, the chore chart stops being a nag list and becomes the first place your kid experiences the loop of work → earn → choose → save. That loop is the foundation under every healthy financial habit they'll build for the next forty years.
Young Bucks Club helps families build money confidence with no-jargon guides and a free budgeting app. In this guide, we'll walk you through the two-list chore chart structure, the four most common pay systems and which one fits your family, age-by-age chore lists with realistic pay rates for 2026, and the weekly ritual that keeps the whole thing alive past the first month.
The Core Building Blocks of a Money-Teaching Chore Chart
A chore chart that actually teaches money has more structure than the printable PDFs you'll find on Pinterest. It's not just a list of jobs with checkmarks. It's a deliberately split system — one side carries the unconditional family work, the other carries the earnable jobs — and that structure is what produces the lesson. A 2026 family-finance study by the American Institute for Economic Education found that kids whose chore charts visibly distinguished paid jobs from family contributions scored 42% higher on basic money-concept tests by age 11 than kids with single-list "do chores, get allowance" systems. The split is the lesson.
Building Block 1: Family Contributions vs. Paid Jobs
The single most important design choice in a money-teaching chore chart is the two-column split. Family contributions are the chores your kid does because they live in the house — feeding the dog they begged for, putting their own laundry away, clearing their own plate. These never come with a price tag. Paid jobs are the work above and beyond personal upkeep — tasks that, if you didn't pay your kid for them, you might genuinely consider paying someone else for. The line is drawn on the chart, in two columns, so a 7-year-old can see it.
- Family contributions (unpaid): Making the bed, clearing the table, putting away own toys, getting dressed without prompting, brushing teeth.
- Paid jobs (per-task or per-week): Taking out the trash, sweeping the porch, washing the car, weeding a garden bed, vacuuming common areas.
- Bonus jobs (one-off, premium pay): Helping clean out the garage, raking leaves the whole yard, washing the windows. Limited supply, higher rate.
- Penalty events (negative pay): Optional - some families dock pay if a paid job is started but abandoned. Communicate the rule before it ever happens.
When your kid asks why making the bed is unpaid and emptying the dishwasher gets a dollar, you've reached the actual teaching moment. The answer is simple and worth rehearsing: "Some things you do because you're part of this family. Some things you do because someone is paying for the work. Adults have both, too." That sentence does more financial education in 12 seconds than a 30-minute lecture.
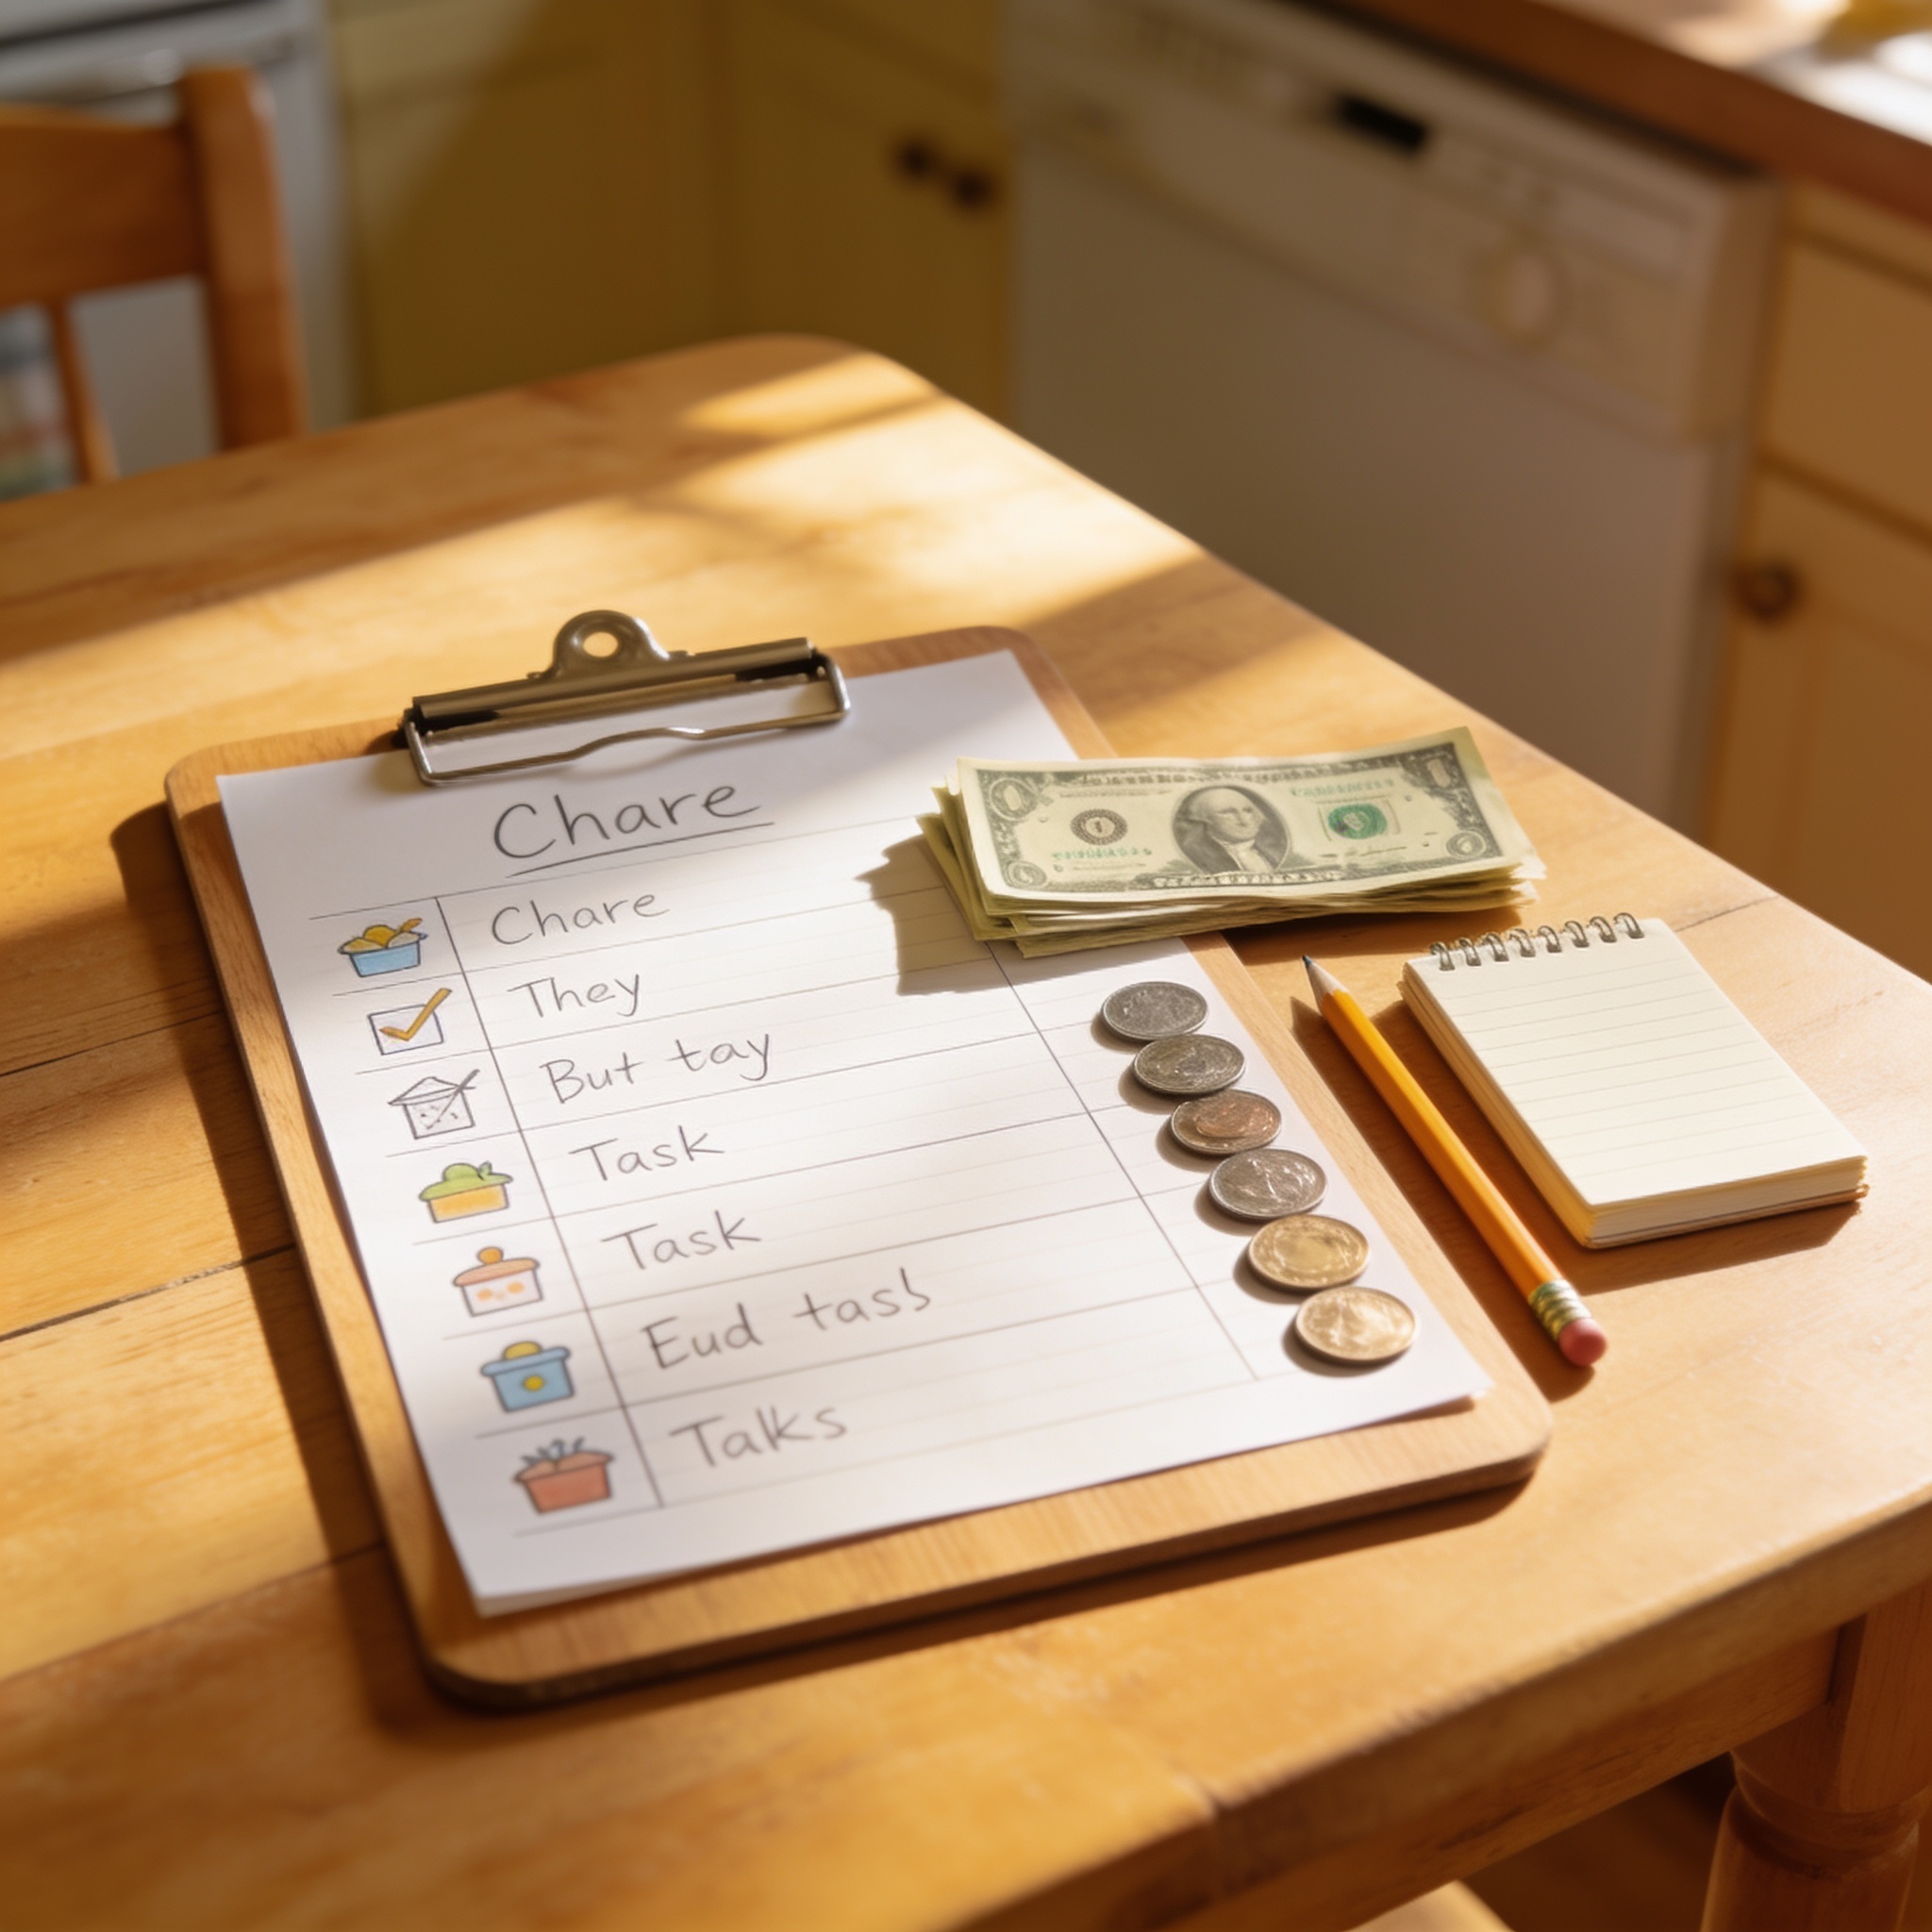
Building Block 2: Visible Tracking, Then Money That Goes Somewhere
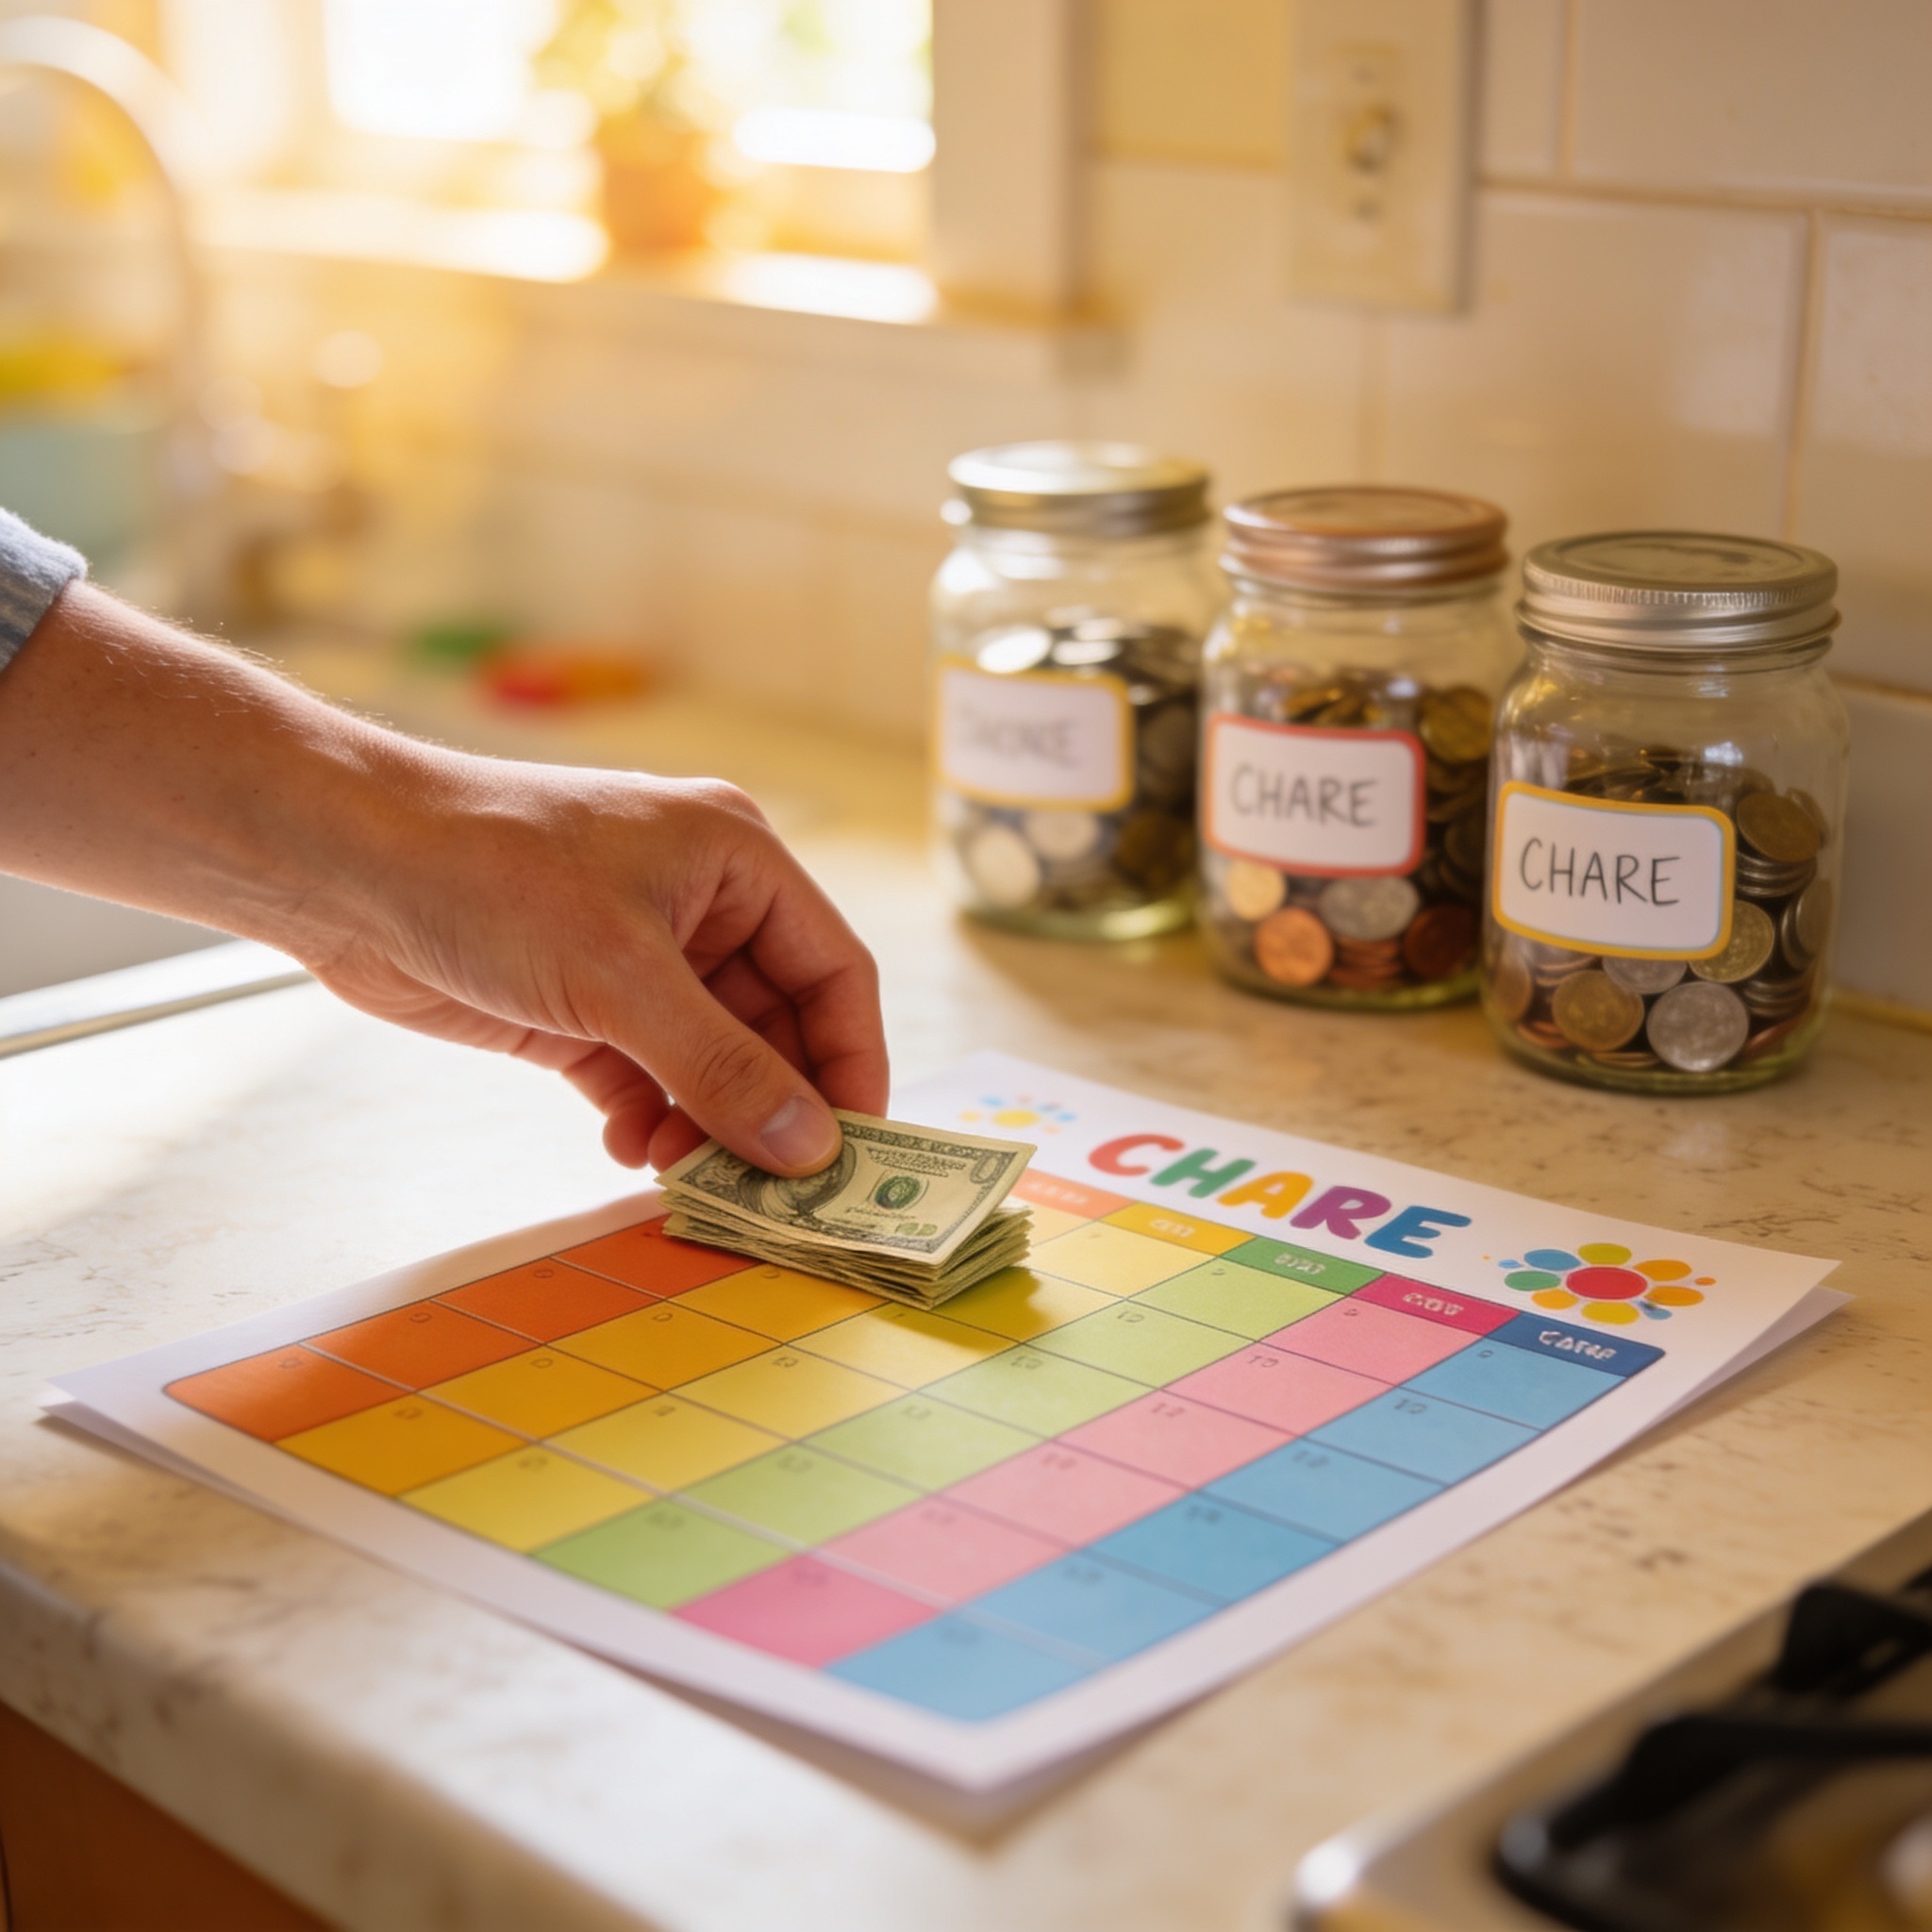
The second core piece is tracking — and the tracking has to be visible. A chore chart in a drawer, a notebook on a shelf, or a private app no one opens dies inside two weeks. The successful systems all share one trait: the chart lives where the family passes through daily. Fridge door, mudroom wall, the side of a kitchen cabinet. Stickers, dry-erase marker, or magnetic checkmarks all work — the medium matters less than the visibility.
The other half of the system is what happens to the money once it's earned. Cash handed over and pocketed disappears. Money split into three labeled jars (Spend / Save / Give) on payday — or split inside a budgeting app the same evening — is what completes the loop. Without this step, the chore chart pays your kid for work but skips the actual money lesson entirely.
The payoff of doing both pieces — the split lists and the split jars — is that your kid will, by the end of month two, start saying things you didn't expect: "I'll do the extra job because I'm $4 short on the bike fund." That sentence is the entire goal of this exercise.
How to Choose the Right Chore-Pay System for Your Family
There are four well-tested chore-pay structures in 2026, each producing a slightly different money lesson. Most families end up running one for a season, learning what their kid responds to, then adjusting. Use the comparison below to pick a starting point — none is universally "best." The best one is the one you'll actually run for three months straight.
| System | How It Works | Best For | Trade-off |
|---|---|---|---|
| Flat Allowance | Fixed weekly amount, chores expected but not tracked | Ages 5–7, families wanting low admin | Weak cause-and-effect; the money lesson is thinner |
| Pay-Per-Chore | Each paid job has a rate; tally weekly | Ages 6–10, cause-and-effect learners | More tracking; kids may cherry-pick easy jobs |
| Hybrid (Base + Bonus) | Small flat amount plus pay for bigger jobs | Ages 9–12, mirroring salary-plus-bonus reality | Requires deciding what counts as base vs. bonus |
| Commission Only | No work means no money — no base, no bailouts | Ages 11–14, future-entrepreneur kids | High motivation when working, hard weeks feel harder |
| Streak-Based | Daily checkmarks unlock a weekly bonus multiplier | Ages 6–9, habit-building stage | A missed day mid-week can sap motivation fast |
Expert tip: Don't optimize the rates on day one. Start the pay scale at your child's age in dollars per week as a total target (a 7-year-old earns about $7, a 10-year-old about $10). Adjust after three full payouts when you can see what actually feels motivating and what feels arbitrary. Almost every family overpays in week one and quietly underpays in week six — start in the middle and tune from there.
What if my kid only does the high-paying chores?
This is the most common pay-per-chore failure mode — by week three, the dollar tasks have been done four times and the 25-cent tasks haven't been touched. Here's the playbook for fixing it, in order:
- Reset the rates. If the highest-paid job pays more than 3x the lowest-paid job, your scale is broken. Adjust so the ratio is closer to 2:1 — high-effort still pays more, but cherry-picking gets less profitable.
- Cap the high-paying jobs. The lawn-mow can only happen once a week regardless of how willing your kid is. Scarcity creates appetite for the smaller jobs.
- Bundle low-paying tasks into a "small jobs" combo that pays a single, larger amount. Five 25-cent tasks done in a row earns $2, not $1.25.
- Move to a hybrid model. A $3 flat base for the family-contribution side, plus pay-per-chore for the rest. Now every job feels additive instead of cherry-pickable.
If you're still working out whether to tie allowance to chores at all before you build the chart, our complete allowance guide covers the chores-or-no-chores debate and age-by-age amounts in detail.
Paper Chart vs. App-Based Tracking
For kids 5–9, a paper chart on the fridge beats every app in existence. Their brains haven't yet bridged the gap between a screen number and a dollar in their hand, and the physical motion of drawing a checkmark or peeling a sticker is itself part of the reward. A whiteboard, a laminated printable, or a magnetic chart all do the job — the medium matters far less than the visibility.
For kids 10–14, an app-based or hybrid tracker starts winning. They handle digital money in real life — Venmo from grandma, tap-to-pay at the bookstore — so a digital chore tracker feels native rather than abstract. The transition itself becomes a lesson: an earned dollar in an app is just as real as a dollar in a jar. By age 12, the chart often lives entirely in the app, and the fridge real estate goes back to magnets and school art.
Chore Charts That Match Every Age and Family
The same two-list framework runs from preschool through middle school — but the chores themselves, the pay rates, and the tracking method all shift as your kid grows. Here's how the chart evolves across the ages where it matters most:
- Ages 5–7 (introduction stage): 2–3 family-contribution tasks (make bed, clear plate, brush teeth), 1–2 paid jobs (feeding pet, sorting laundry by color). Sticker chart on the fridge. Pay at $0.25–$0.50 per job, totaling $2–$4 per week. The lesson is "work happens, then money happens" — that's it.
- Ages 8–11 (cause-and-effect stage): 3–4 family contributions, 4–6 paid jobs at varied rates ($0.50–$2 per job). Whiteboard or magnet chart, kid does their own tracking. Sunday payday. Money splits into three jars the same evening. Total weekly earnings roughly $5–$12.
- Ages 12–14 (independence stage): Move to hybrid model — small flat base ($5–$8/week) plus pay for 3–5 bigger jobs ($2–$5 each). Chart lives in the app. Weekly payday becomes biweekly to mirror real paychecks. Total earnings $15–$30+ per week. This is the bridge to a first real job.
Three Tiers by Family Bandwidth
- Light (5-minute weekly): One small chart on the fridge with 4–5 total tasks. Pay in cash on Sunday. No app. Works for families with one kid under 8 and no time for admin. Total cost: about $3–$6 per week per kid.
- Standard (10-minute weekly): Split-list chart, 8–10 total tasks, mix of paid and unpaid. Sunday payday into three jars or BuckBook. Works for families with kids 7–11. Total cost: $5–$12 per kid.
- Comprehensive (15-minute weekly): Hybrid base-plus-bonus, separate charts per kid, app-based tracking, biweekly payday for the older kid. Works for multi-kid families with at least one tween. Total cost: $15–$30 per older kid, less for younger.
Modern Family Adjustments for 2026
Most family money in 2026 is invisible — tap-to-pay, peer-to-peer transfers, the occasional crumpled bill. That changes how a chore chart actually pays out. Three practical adjustments that fit how households now run:
- The Mixed Payout: Pay half in cash, half digital. Cash gets physically split into jars on Sunday; digital lands in the app. Your kid sees both forms of money behave the same way — the lesson is that money is money regardless of format.
- The Photo-Check: For paid jobs that require a quality bar (clean room, wiped counters), require a quick phone photo before payout. Removes the "did I really do it well enough?" argument and teaches the idea that work isn't done until it's verified.
- The Save-Match: For every dollar your kid moves into their Save jar from chore earnings, match it 25–50% from your account. Mirrors a 401(k) employer match and teaches compounding before they hit a single algebra class.
Why Young Bucks Club Makes a Difference
Most parents who try to build a chore-and-money system quickly hit the same wall: the printables online are cluttered with branding, the apps designed for kids are full of ads, and the spreadsheets meant for grown-ups feel cold and complicated. Young Bucks Club is built specifically for the in-between — old enough for real money lessons, young enough that the tools have to feel light. We don't want your kid spending more time on the app than on the chore.
- BuckBook is free — the kid-friendly budgeting app that handles chore tracking, payouts, and the Spend/Save/Give splits automatically. No premium tier, no upsells, no asterisks.
- No ads to kids — your child never sees a single advertisement inside BuckBook. Their first relationship with earning money shouldn't be interrupted by someone else's marketing.
- Kid-friendly UI — designed so a 7-year-old can check off a chore themselves and an 11-year-old can run a full weekly payout without you in the room.
- Family-account sync — you fund the chore payouts from your account, your kid logs their completed jobs from theirs, and you both see the same chart in real time. No double-entry, no end-of-week reconciliation.
Getting the Most Out of Your Chore Chart
- Run payday at the same time every week. Sunday after dinner is the gold standard — your kid will start asking about it by week three, which is exactly when you want the habit to lock in.
- Let missed chores have real consequences. Don't pay for jobs that weren't done. The lesson of no-work-no-pay is one of the most valuable money lessons your kid will ever get, and it has to come from you before it comes from a manager 12 years later.
- Rotate one chore per month. Same jobs, week after week, become invisible. Swap a single paid job in or out monthly to keep the chart feeling alive without making it overwhelming.
- Celebrate the first save-goal hit out loud. The first time your kid funds a goal entirely from chore money, mark the moment — take a photo, snap a screenshot of the BuckBook balance, frame the receipt. Memory is the multiplier.
If you want the digital version your kid can run themselves, BuckBook at app.youngbucks.club is the chore-tracker, budget, and goal-saver bundled into one free app. Or if your kid is closer to teen years and starting to think about real income, our first paycheck guide picks up the lesson right where the chore chart leaves off.
Frequently Asked Questions About Chore Charts and Money
Should I pay my kid for every chore they do?
No — and this is the most common mistake. Family-contribution chores (making the bed, putting their own dishes in the sink, brushing teeth) should stay unpaid. They're the price of living together. Paid jobs are work above and beyond personal upkeep — taking out the trash, vacuuming the living room, washing the car. The split itself is the lesson: some work is paid, some isn't, and adults navigate both their whole life. Putting both lists side by side on the same chart is what makes the distinction click.
What's a fair amount to pay for chores in 2026?
A useful starting rule is "age in dollars per week" as the total payout target — so a 7-year-old earns about $7 across all their paid jobs, a 10-year-old about $10. Within that total, smaller jobs land at $0.25–$0.50 each and bigger jobs at $1–$3 each. For tweens 11–14, the total often climbs to $15–$25 per week, especially if you've moved to a hybrid base-plus-bonus structure. Match the floor to your local context — what your kid's friends earn matters more than what the internet says.
What do I do if my kid stops doing their chores after a few weeks?
First, check the chart's visibility — if it's not somewhere everyone passes daily, that alone causes about half the failures. Second, check the rates — if pay-per-chore feels too low for the effort, motivation tanks fast. Third, check the payday — if you've been late or inconsistent on payouts even once, the cause-and-effect lesson is fading. Fix those three things in that order before changing the system itself. Most chore-chart failures are mechanical, not motivational.
Conclusion
A chore chart isn't really a tool for getting the dishwasher emptied. It's the first formal place your kid will experience the rhythm of working, earning, choosing, saving, and reviewing — a rhythm they'll repeat for the next 60 years, just with bigger numbers and longer time horizons. The dishes are a bonus. The split between family contributions and paid jobs is what gives your kid the mental model that money is connected to specific, completed work — not to mood, not to begging, not to being a good kid. That model, set early, quietly outperforms almost every other financial lesson you'll try to teach.
If you'd like a ready-made two-list chore chart printable, age-by-age task suggestions with realistic 2026 pay rates, and a Sunday payday script — join Young Bucks Club free and we'll send you the Money Starter Kit. Or open BuckBook directly if you want the chore tracker, payouts, and Spend/Save/Give splits already wired together in a free kid-friendly app.
Try BuckBook — Free
The kid-friendly chore tracker and budget app for ages 5–14. Log chores, run payday in 60 seconds, and watch your kid's Save jar grow. No ads to kids. Free forever.
Open BuckBook Free →